If you are teaching graphing or line plots in math, I am sure you’re familiar with the struggle to find engaging and fun ways to help students read and create the dreaded line plot graph! It’s no secret that analyzing and interpreting data can be tricky for kids in 3rd, 4th & 5th grade. Line plots seem to take “tricky” to the next level for my students. There are so many parts of a line plot graph, and then let’s sprinkle in some fractions!?! WHAT?
Keep reading for your FREE Graphing Activities!
We can make line plots with fractions easier to understand by covering bar graphs and pictographs well beforehand in math. Most students find creating graphs relatively easy because it is so visual in nature. Reading and answering complex graphing questions is where the real learning takes place!
Class Created Line Plots in Math
Use a simple number line on the whiteboard, sticky notes with each students’ name and survey the class! Here are some questions you can use. How many pets do you have? How many minutes do you read every day? What is the length of your pencil? or other objects.
Now that you have your line plot, it’s time to interpret the data!
Start with simple questions like:
- How many students had 3 pets?
- How many students read 15 minutes?
- Which length of pencil was the most/least popular?
Then increase the difficulty so students can analyze the line plot.
- How many students had 4 or more pets?
- How many students read less than 15 minutes?
- How many students took this survey?
After your students have answered several questions about your line plot, its time to dig deep into the data with some advanced questions like these!
- How many total pets are represented in this line plot?
- How many total minutes were read by the students that read 25 minutes a night?
- What is the total length of the pencils measuring 4 1/2 inches?
Line Plots in Math Practice
Now that students have created line plots in math using their own data. It’s time to practice and apply our new graphing skills!
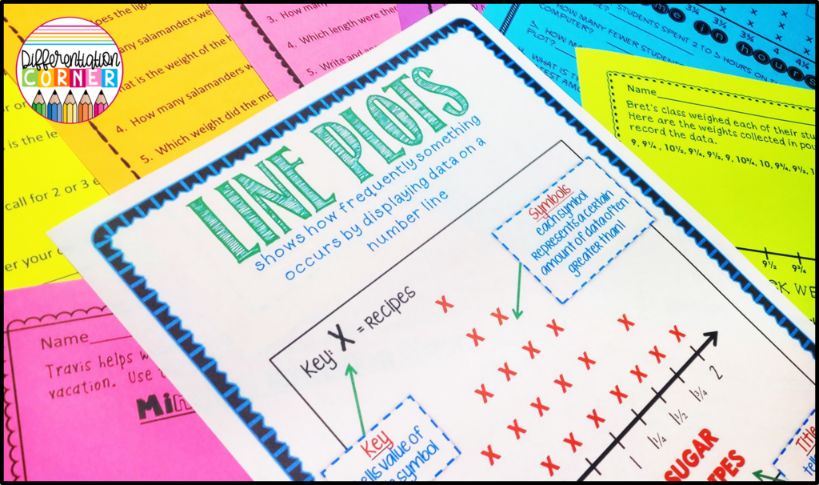
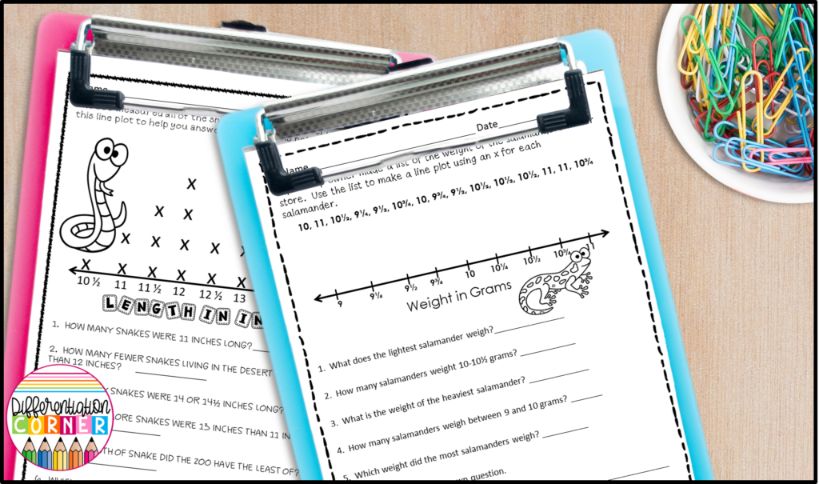
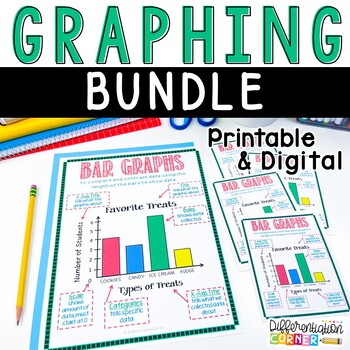
It is so hard to find worksheets on line plots that were appropriate for upper elementary. I created these line plots worksheets for 3rd, 4th & 5th grade and included a line plot anchor chart and some fun digital activities, too! This blog post has great tips for teaching with Google Slides. If you need a complete graphing unit with bar graphs, pictographs & line plots activities, check this out!
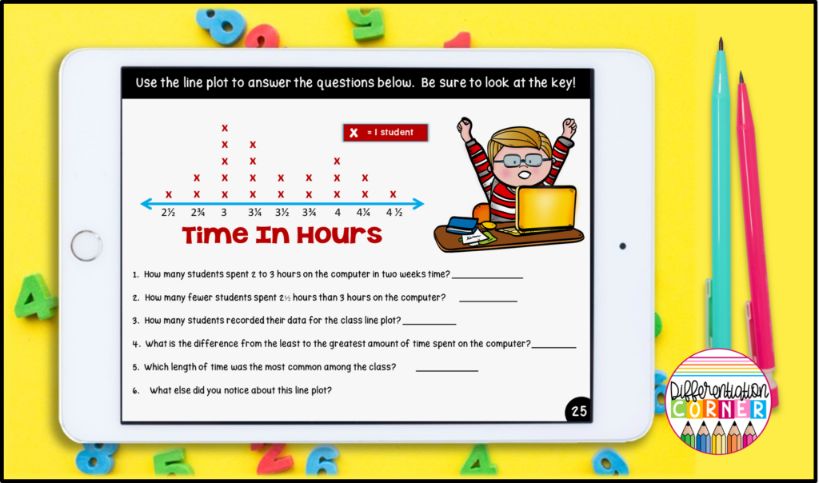
These line plot graphs with fractions worksheets have worked great for small group math centers. I can really see what my students need.

Grab your FREE Graphing Activities HERE!
Looking for help teaching students to solve two step story problems? or some ideas on setting up your math centers? You’ll love these ways to use your task cards in your classroom!


